
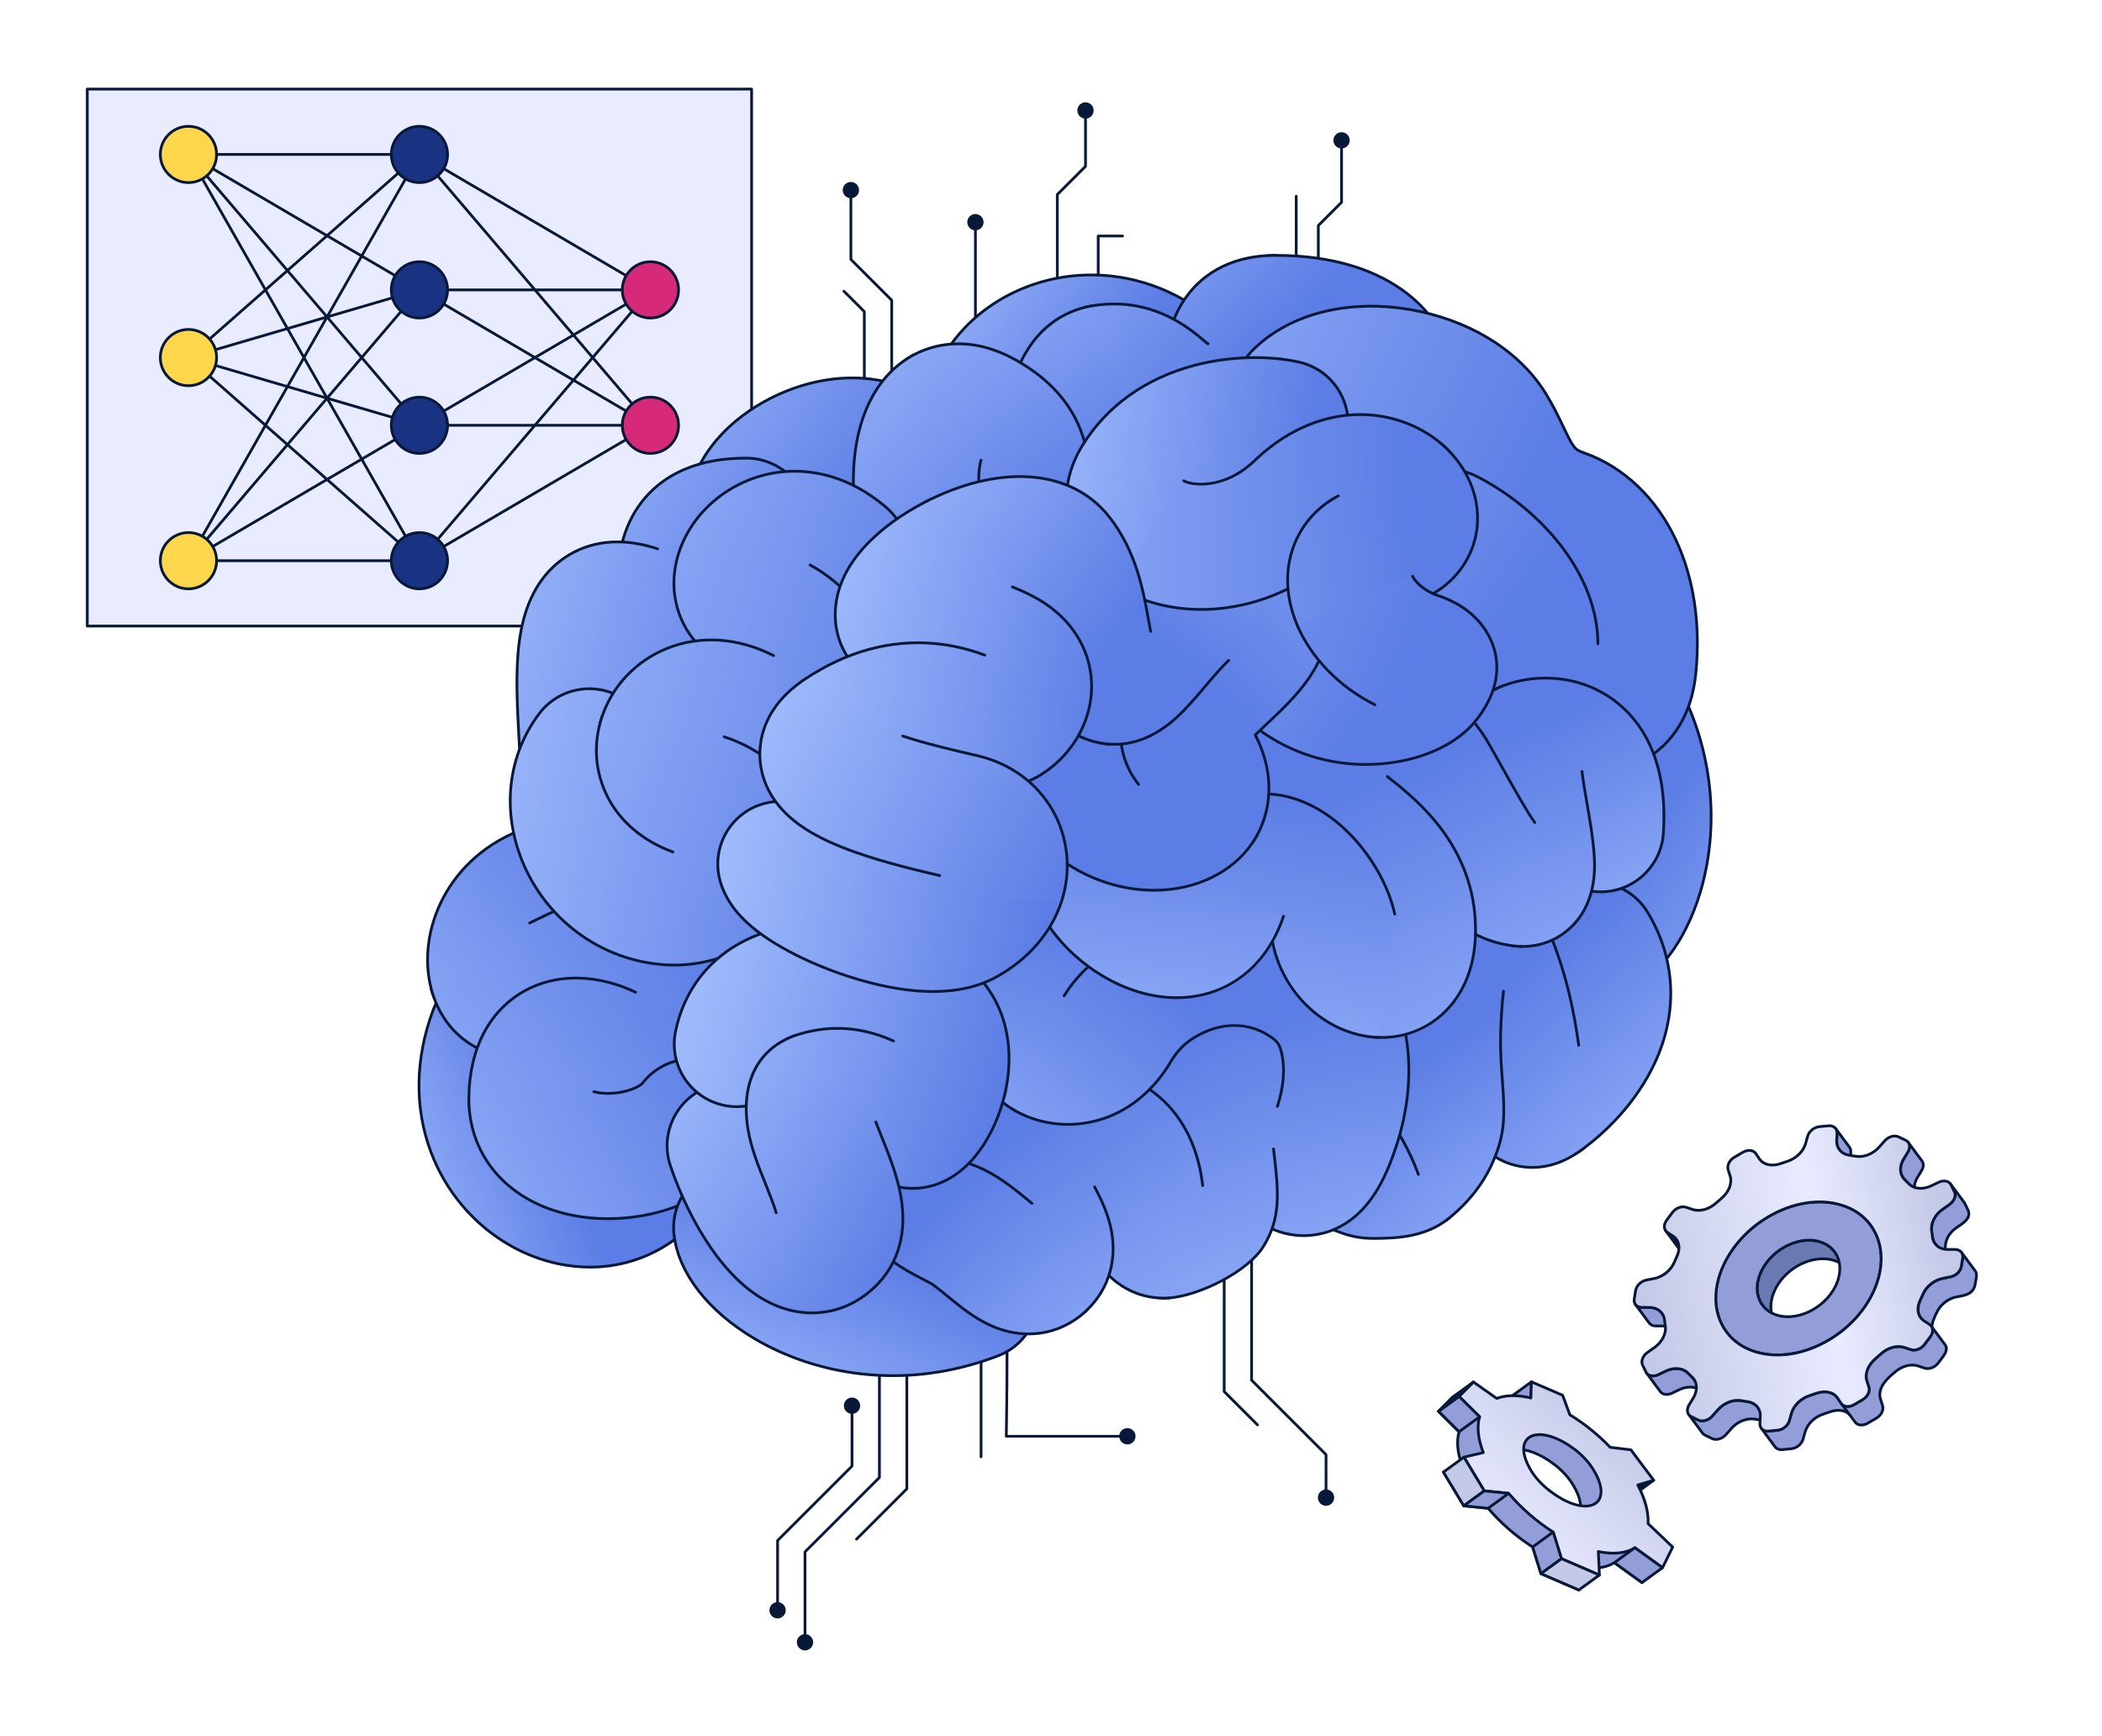
Our Technology
The cellular blueprint for therapeutic success
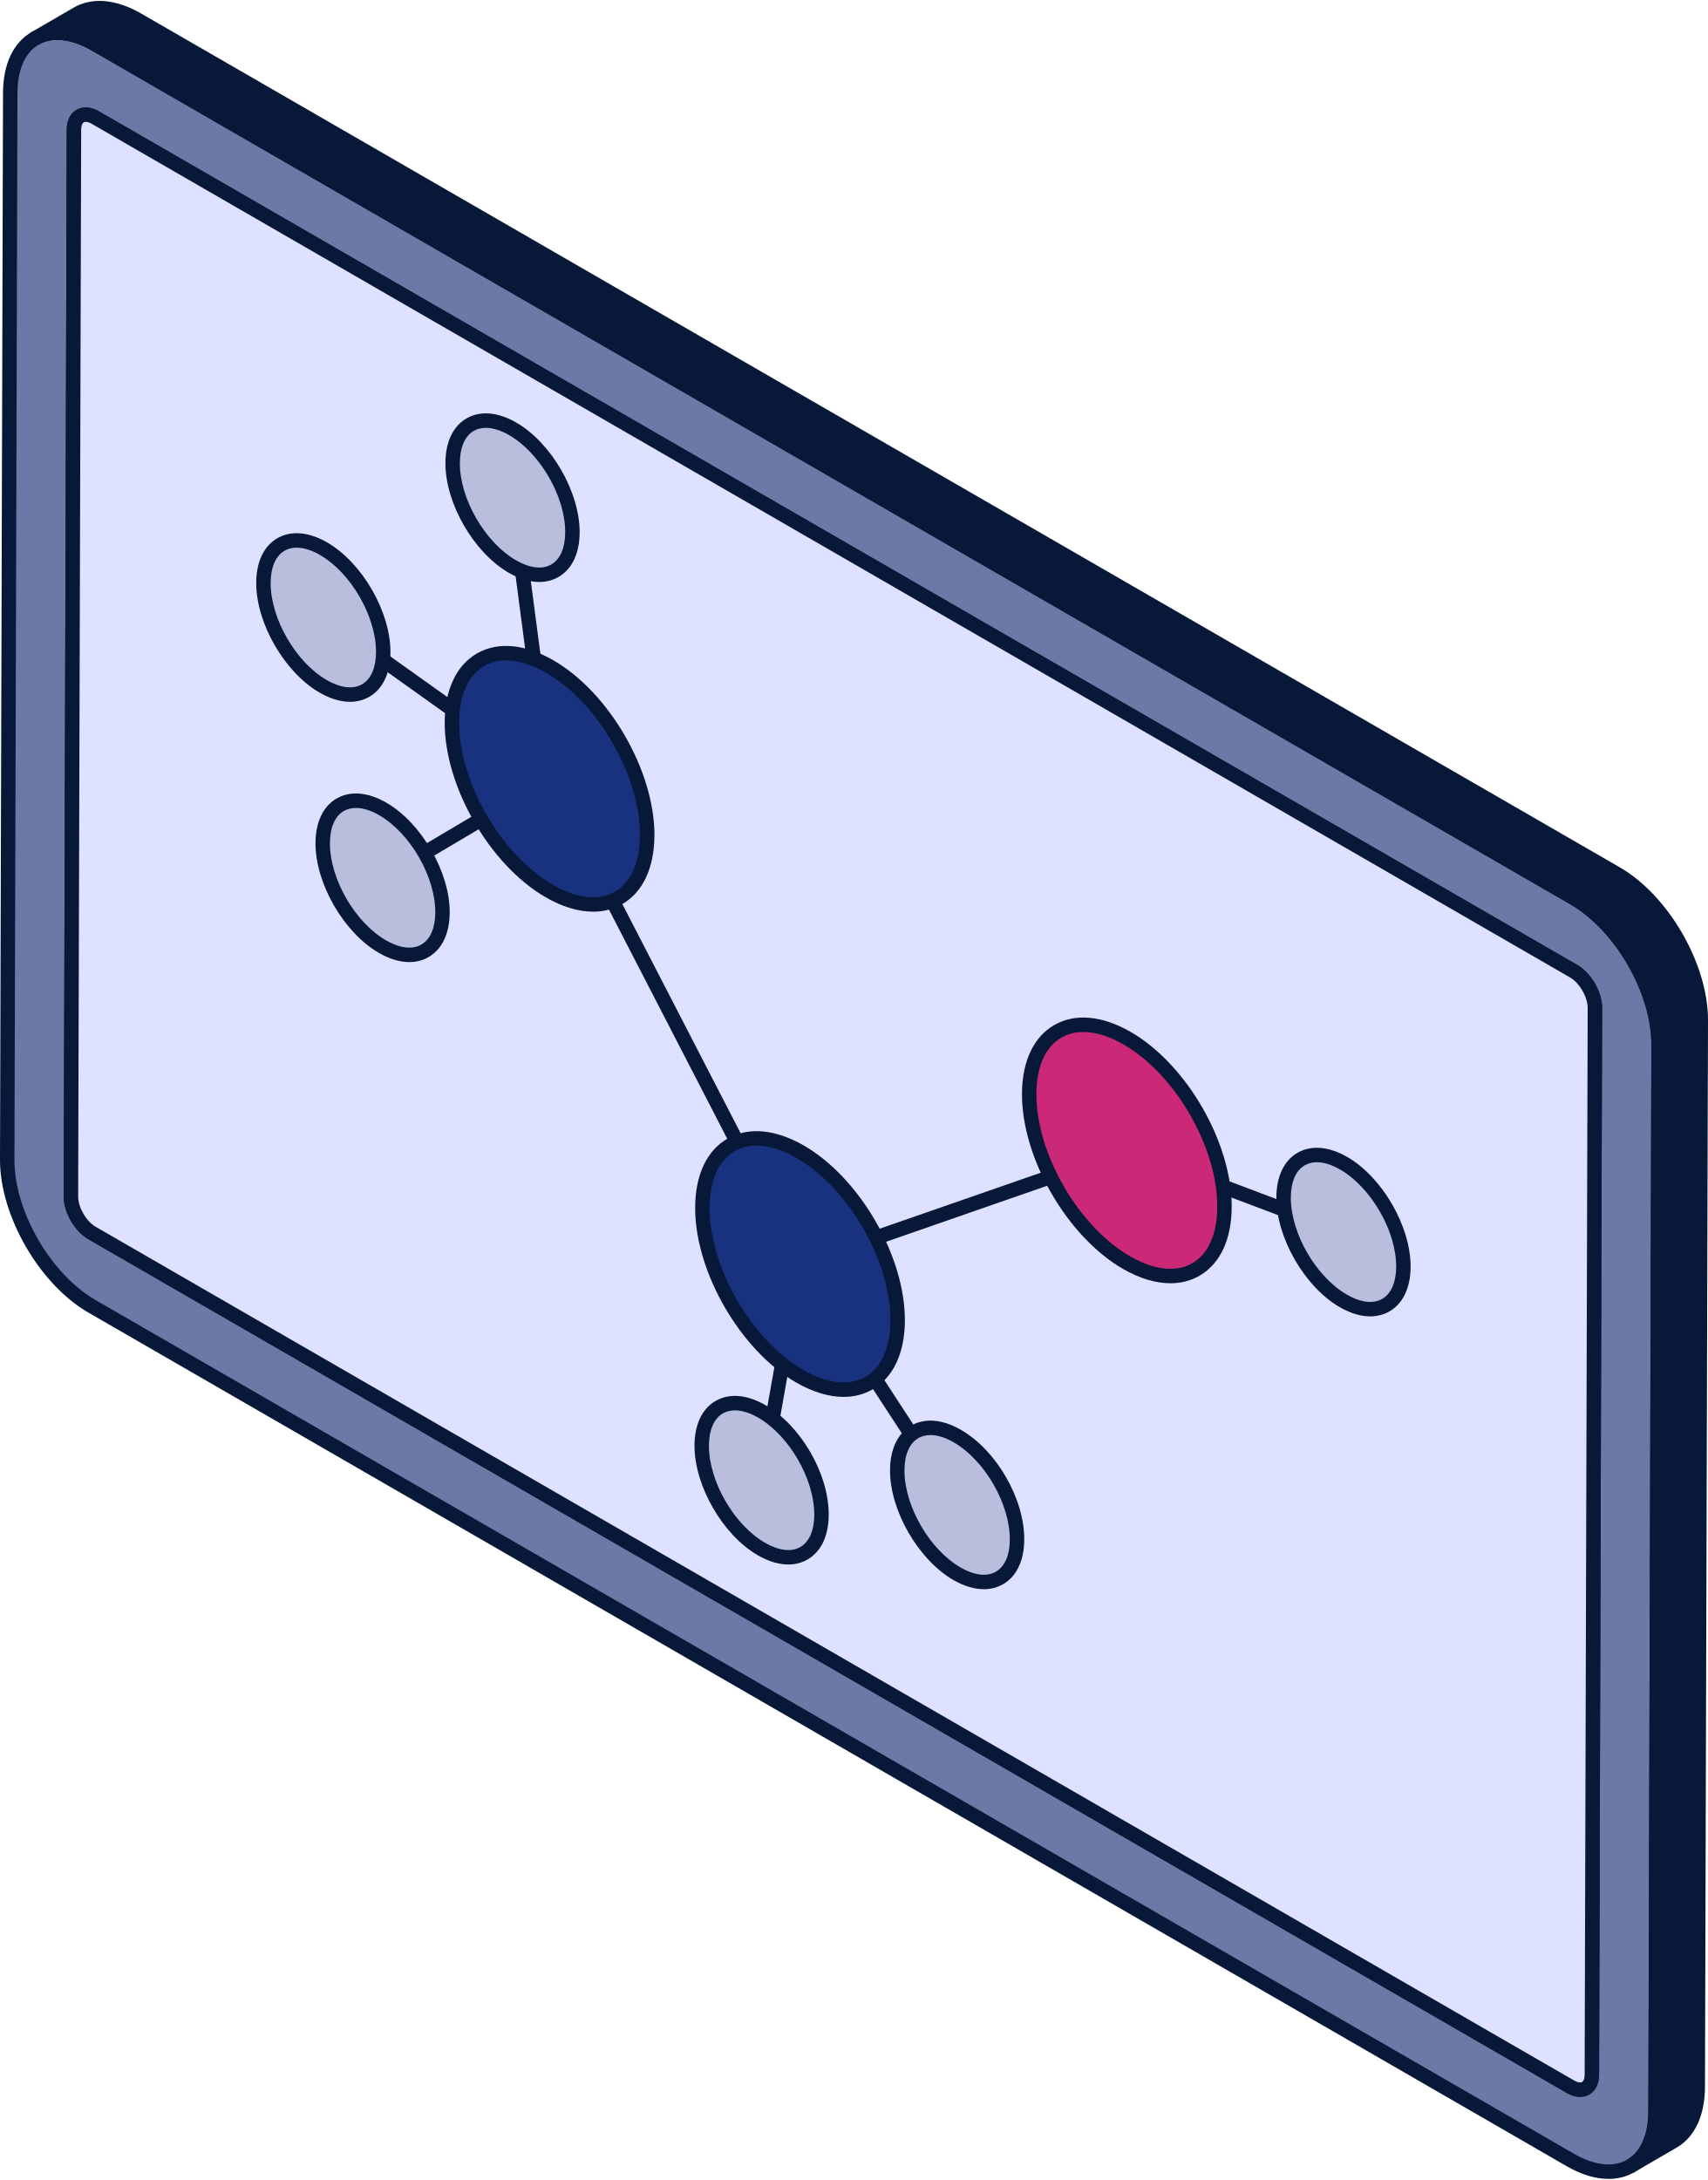
Comprehensive Profiling
Simultaneously measure hundreds of binary protein-protein interactions within a targeted network of key signaling proteins
The QMI Assay
OUR EXPERIMENTAL ENGINE

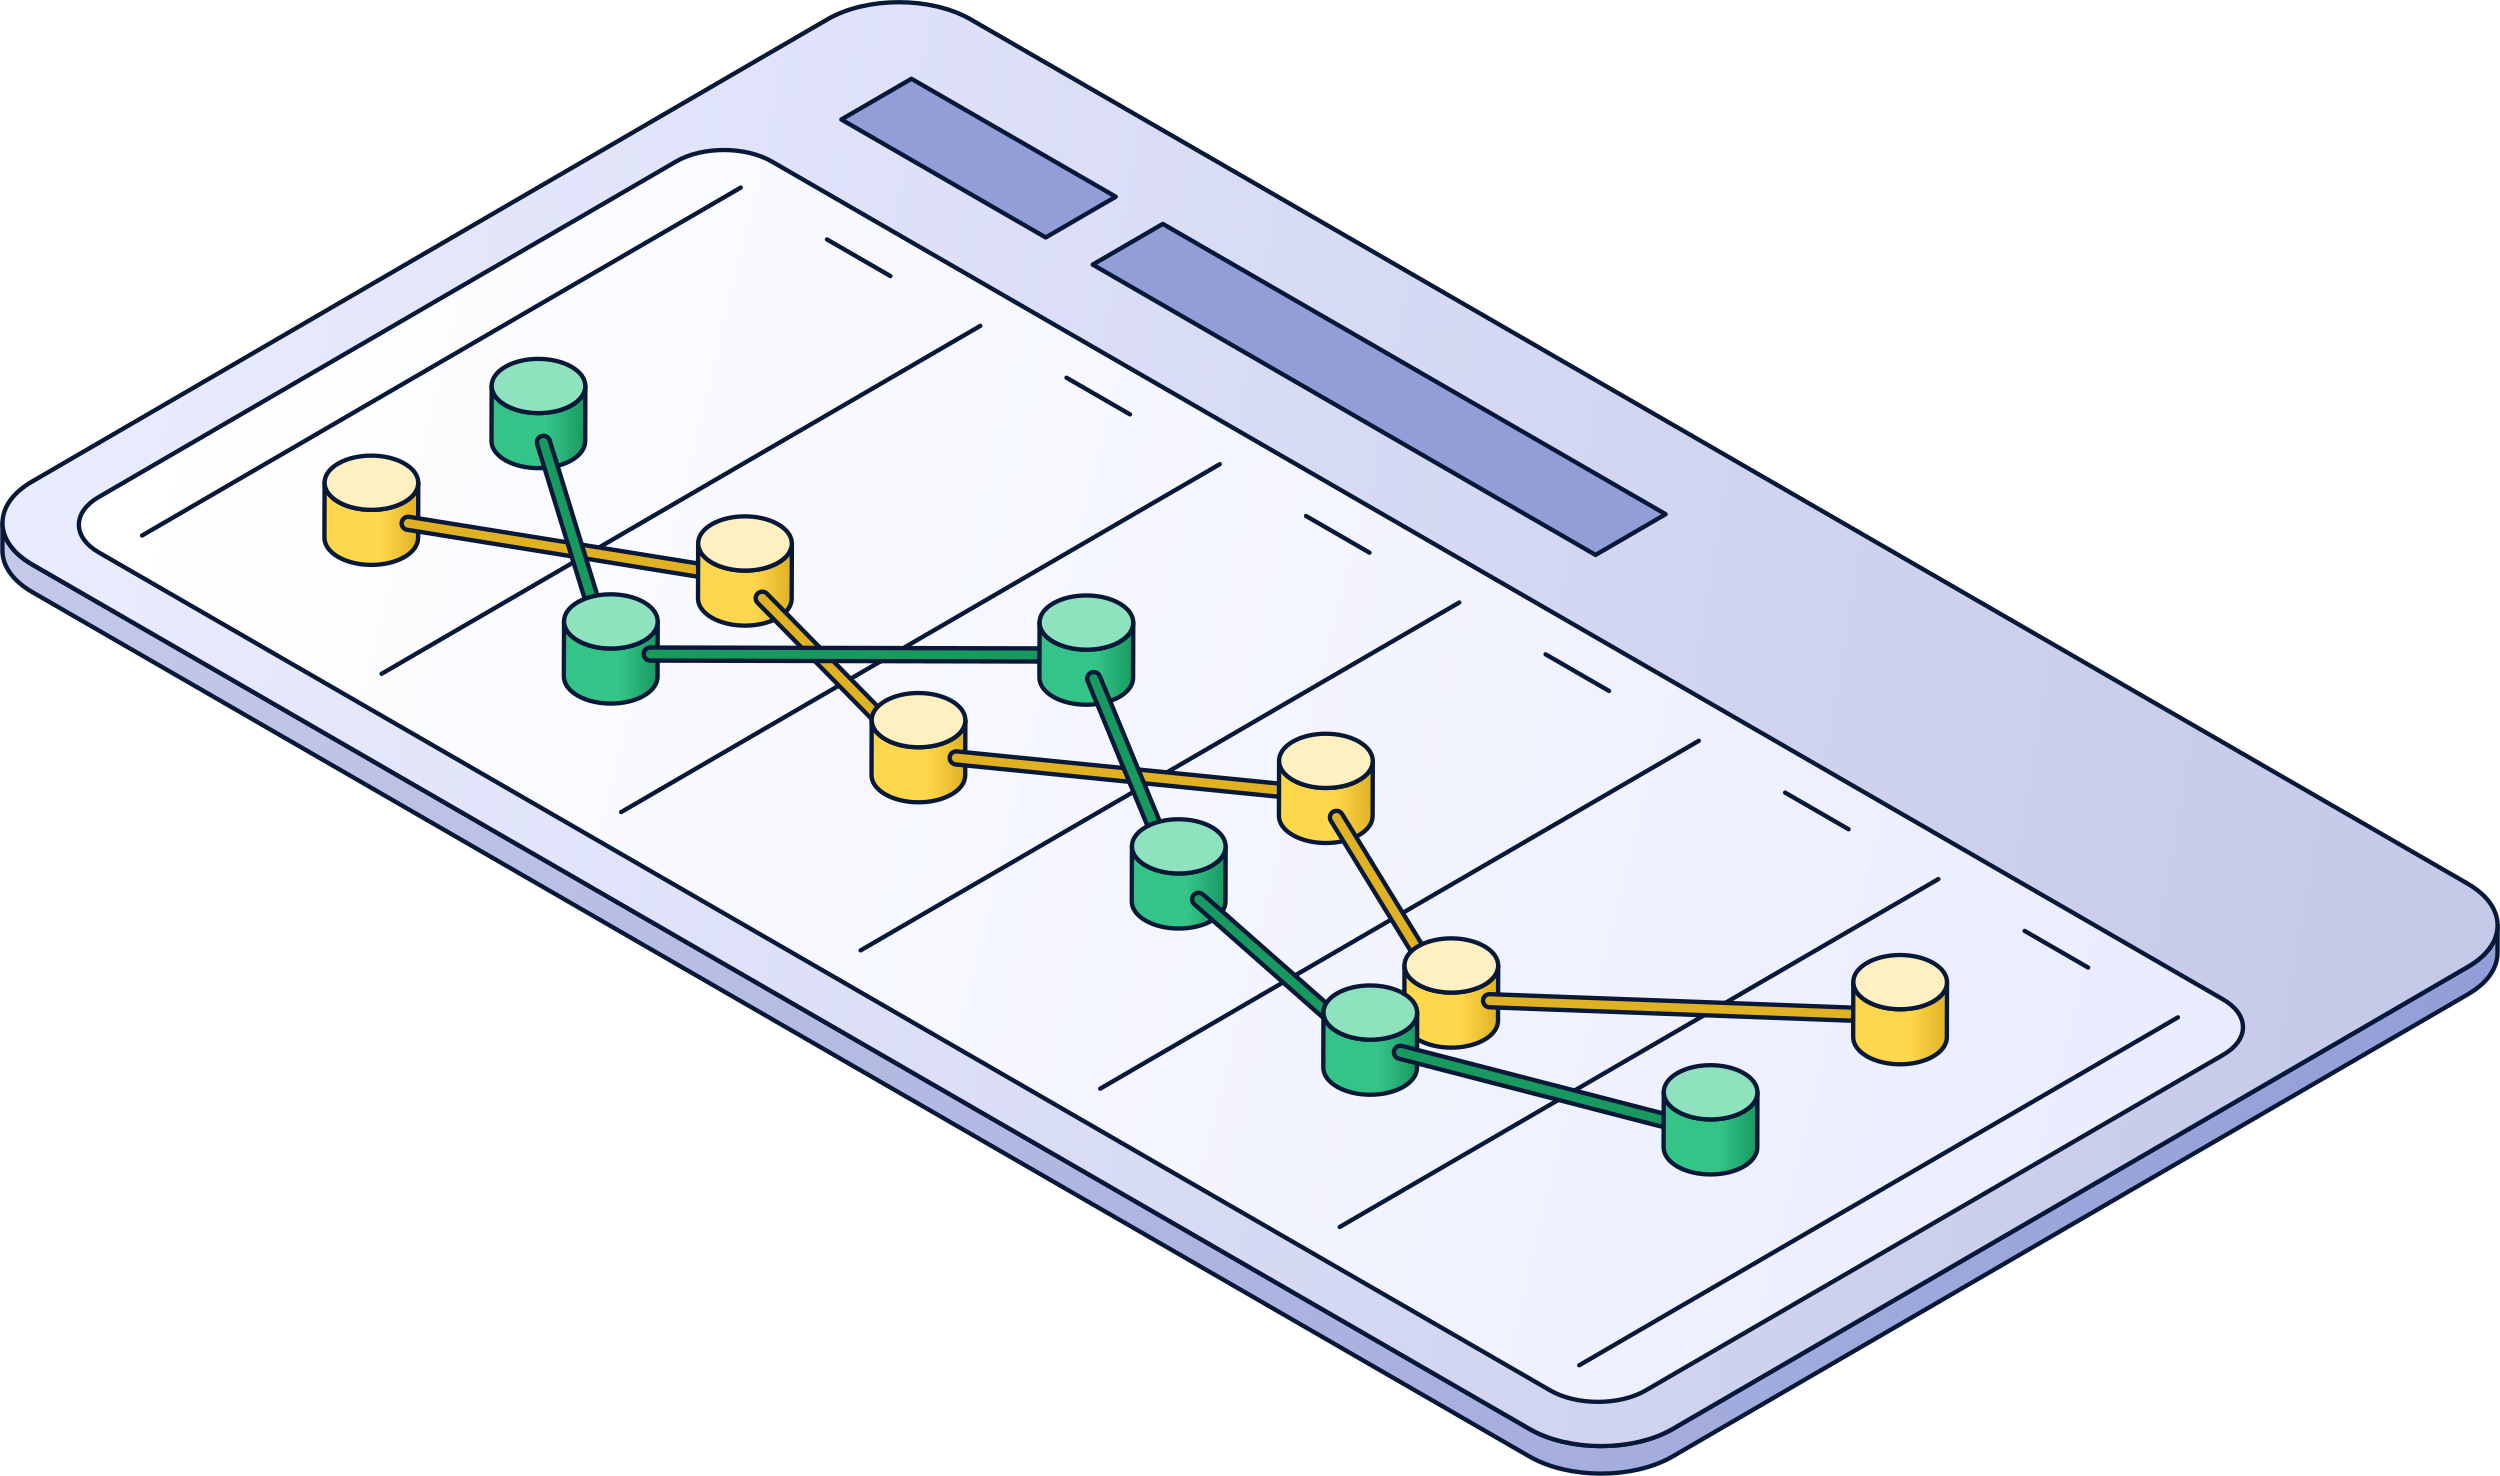
High-Resolution Quantification
Precise, quantitative measure of protein co-association in its native state, capable of detecting small but physiologically relevant changes in interaction strength

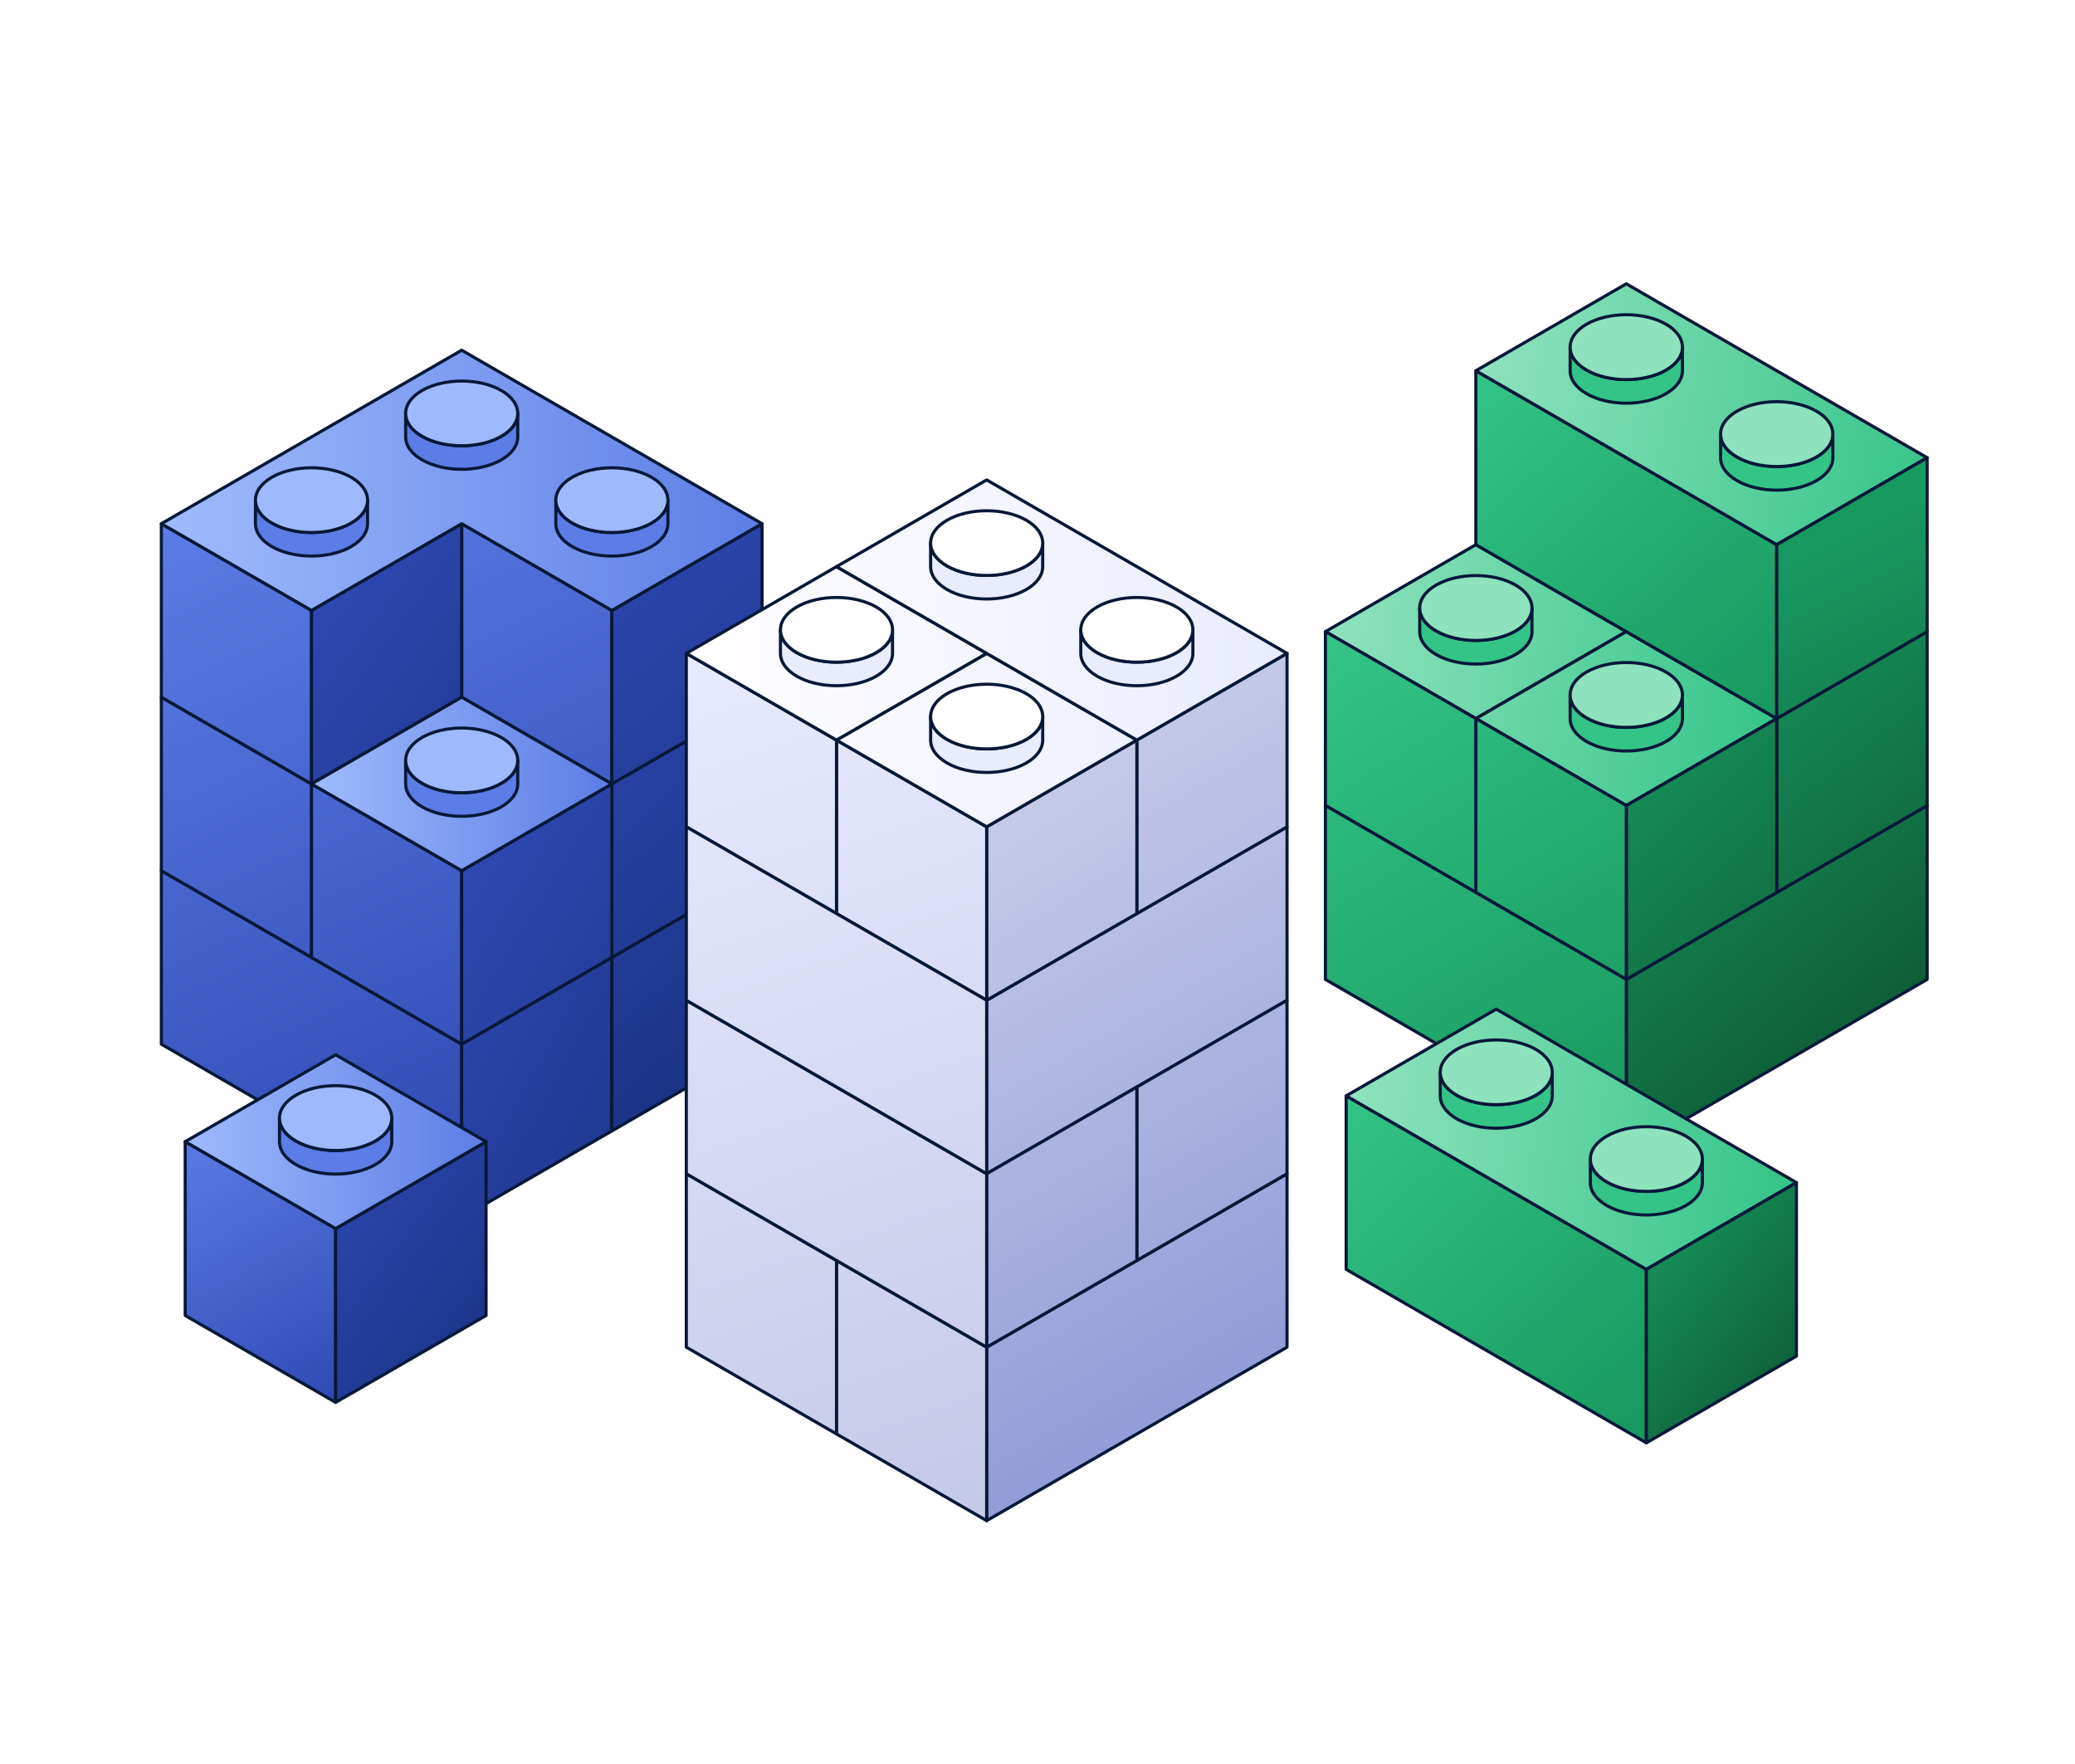
Broad Versatility
QMI has been successfully applied to a diverse range of signaling pathways

OUR PREDICTIVE INTELLIGENCE
AI-Powered Modules
Predictive Biosignatures
Our models learn from QMI data to generate an actionable "biosignature" for each cell product
Uncovering Causal Mechanisms
Differentiate between a clinically successful CAR and a construct that failed in trials, even when standard preclinical assays show no difference

Informing Rational Design
Our platform provides crucial, data-driven insights to refine new CAR designs and optimize administration strategies

QMI + AI-Powered Modules Explained
OUR PROCESS

QMI
ACTIVATE
T cells are stimulated with an antigen or other trigger to set off their internal signaling cascade, capturing the dynamic state of the protein network as it functions
PROFILE
Using our proprietary assay, we capture and quantify hundreds of protein-protein interactions from a targeted signaling network
MEASURE
We precisely measure the strength of each interaction to create a rich, quantitative dataset. This provides a detailed look at how the signaling network responds to stimulation, providing the raw data for our analysis
AI
MAP
The rich, quantitative data from our QMI assay is compiled to create a comprehensive map of the cell's signaling network. This map establishes a foundational database of how a therapy's design translates into a cellular response
ANALYZE
Our machine learning models analyze these data maps to identify "modules"—groups of interactions that function together. This process reveals the molecular logic circuits that govern a cell’s response
PREDICT
These modules are then translated into an actionable "biosignature" that predicts specific clinical outcomes, such as the risk of severe Cytokine Release Syndrome (CRS) or Immune Effector Cell-Associated Neurotoxicity Syndrome (ICANS)
VALIDATE
The predictive power of these biosignatures is rigorously validated against banked clinical samples with known patient outcomes. This closes the loop, allowing us to continuously refine our models and provide a high-confidence prediction of a therapy’s safety and efficacy for our partners
For a deeper dive into our methodology and the scientific foundation of QMI, please explore our publications and presentations.